
Enhanced Angular Debugging in DevTools
Overview
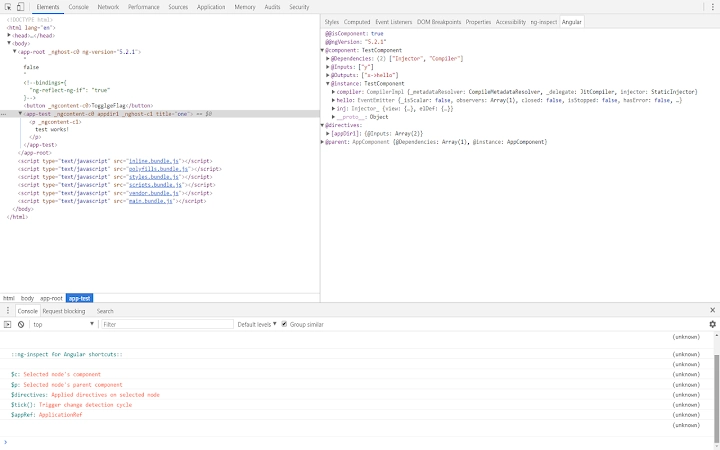
The software is designed to assist developers in debugging Angular applications by extending the functionality of the browser's built-in DevTools. Specifically, it enhances the Elements panel to display component properties directly within the developer interface. This enables faster identification and inspection of component data during development and troubleshooting. The tool is tailored for front-end developers working with Angular frameworks, particularly those who rely on browser-based debugging workflows.
By integrating seamlessly into the existing DevTools environment, the software minimizes workflow disruption while adding valuable insights into component structure and state. It is especially useful during development cycles where real-time component inspection is critical for identifying rendering issues, data binding problems, or state inconsistencies. The target audience includes professional Angular developers, full-stack engineers, and frontend specialists involved in building or maintaining Angular-based web applications.
As the developer did not provide additional background information, the tool's origins remain unspecified. However, its purpose is clearly aligned with modern web development needs, focusing on improving developer efficiency and reducing debugging time. The tool operates within the browser context, requiring no server-side setup or external dependencies, making it ideal for rapid integration into existing development environments.
Key Features & Capabilities
- Component Property Display – Extends the Elements panel in browser DevTools to show Angular component properties, allowing developers to inspect component data without navigating through multiple layers of code.
- Seamless DevTools Integration – Works directly within the browser’s developer tools, preserving the familiar interface and workflow, reducing the learning curve for new users.
- Real-Time Data Inspection – Provides live updates of component properties as the application state changes, enabling immediate feedback during debugging sessions.
- Angular-Specific Optimization – Tailored specifically for Angular applications, ensuring compatibility with Angular’s component structure and change detection mechanisms.
- Lightweight Design – With a file size of 1.2 MB, the extension is optimized for minimal impact on browser performance and loading times.
These features are particularly beneficial when troubleshooting rendering issues, validating data flow between components, or verifying state updates in complex component hierarchies. For example, a developer can quickly locate a specific component in the DOM, expand its properties, and verify whether bound values match expected states—without switching to the Console or Sources tabs.
User Interface, Workflow & Performance
The user interface is fully integrated into the browser’s DevTools environment, specifically extending the Elements panel. Navigation remains consistent with standard DevTools behavior, ensuring a smooth experience for users already familiar with Chrome or Edge developer tools. The addition of component property information appears as collapsible nodes within the DOM tree, preserving visual clarity and logical organization.
Workflow efficiency is enhanced by allowing developers to inspect component data directly where they are already working—during DOM inspection. This eliminates the need to switch between tabs or manually trace component logic. The tool operates in real time, updating component data as the application state evolves, which supports dynamic debugging scenarios.
The developer did not specify resource usage details. Performance observations are based on general software behavior patterns. Given the lightweight nature of the extension (1.2 MB), it is expected to have minimal impact on CPU and RAM usage. Stability is assumed to be consistent with standard browser extensions, though no formal reliability metrics were provided.
Compatibility & System Requirements
The software is compatible with Windows and Mac operating systems. It is designed to function within modern web browsers that support DevTools extensions, such as Google Chrome and Microsoft Edge. The extension version is 1.0.0, with a total installation size of 1.2 MB.
Exact system requirements were not listed. Compatibility information was partially provided. The tool does not require additional software or runtime environments, as it operates entirely within the browser context. No hardware-specific demands were mentioned, suggesting it is suitable for standard development machines.
Pros and Cons
Pros
- Direct integration with browser DevTools enhances workflow continuity.
- Provides immediate access to Angular component properties during debugging.
- Lightweight and fast-loading, minimizing performance overhead.
- Specifically built for Angular, ensuring accurate and relevant data display.
- Free to use, with no licensing or subscription barriers.
Cons
- Functionality is limited to Angular applications and browser DevTools.
- Does not support other frameworks or IDEs.
- May not function with older or non-standard browser versions.
- Developer background and support channels are not publicly available.
- Performance impact details were not disclosed.
FAQ Section
Is this tool compatible with all web browsers?
The software is designed for browsers that support DevTools extensions, such as Chrome and Edge. Compatibility with other browsers is not confirmed.
Can I use this tool offline?
Yes, once installed, the extension functions without requiring an internet connection, as it operates within the browser’s local environment.
Is the software secure to install?
As a browser extension, it runs in a sandboxed environment with limited access to system resources. No security vulnerabilities were reported at release.
How often are updates released?
Update frequency is not specified. The current version is 1.0.0, released on May 10, 2024.
What type of license does this tool use?
The software is available for free and does not require a license key or registration.
Final Thoughts
For Angular developers seeking a more efficient debugging experience, this tool offers a focused, lightweight enhancement to browser DevTools. By bringing component property visibility directly into the Elements panel, it streamlines the debugging workflow and reduces context switching. While its scope is limited to Angular and browser-based development, this specificity ensures high relevance and precision.
Given its free availability, minimal footprint, and clear purpose, it is a valuable addition to any Angular developer’s toolkit. The lack of detailed documentation or developer information may be a concern for enterprise users, but for individual developers and small teams, the benefits outweigh the limitations.
Download Enhanced Angular Debugging in DevTools now.